Enterprise Fleet Management.
Without the Enterprise Contract.
The same features Fortune 500 companies pay thousands for — available self-serve, starting at $8.95/mo per vehicle. No sales calls. No demos. No 3-year lock-in.

Vehicles, trailers, and equipment. One account, one map, one app.
- Vans & trucks
- Trailers
- Powered equipment
- Battery-tracked assets
Live tracking
Run today's operation
See where every vehicle, trailer, and piece of equipment is right now — and what needs your attention before a customer calls.
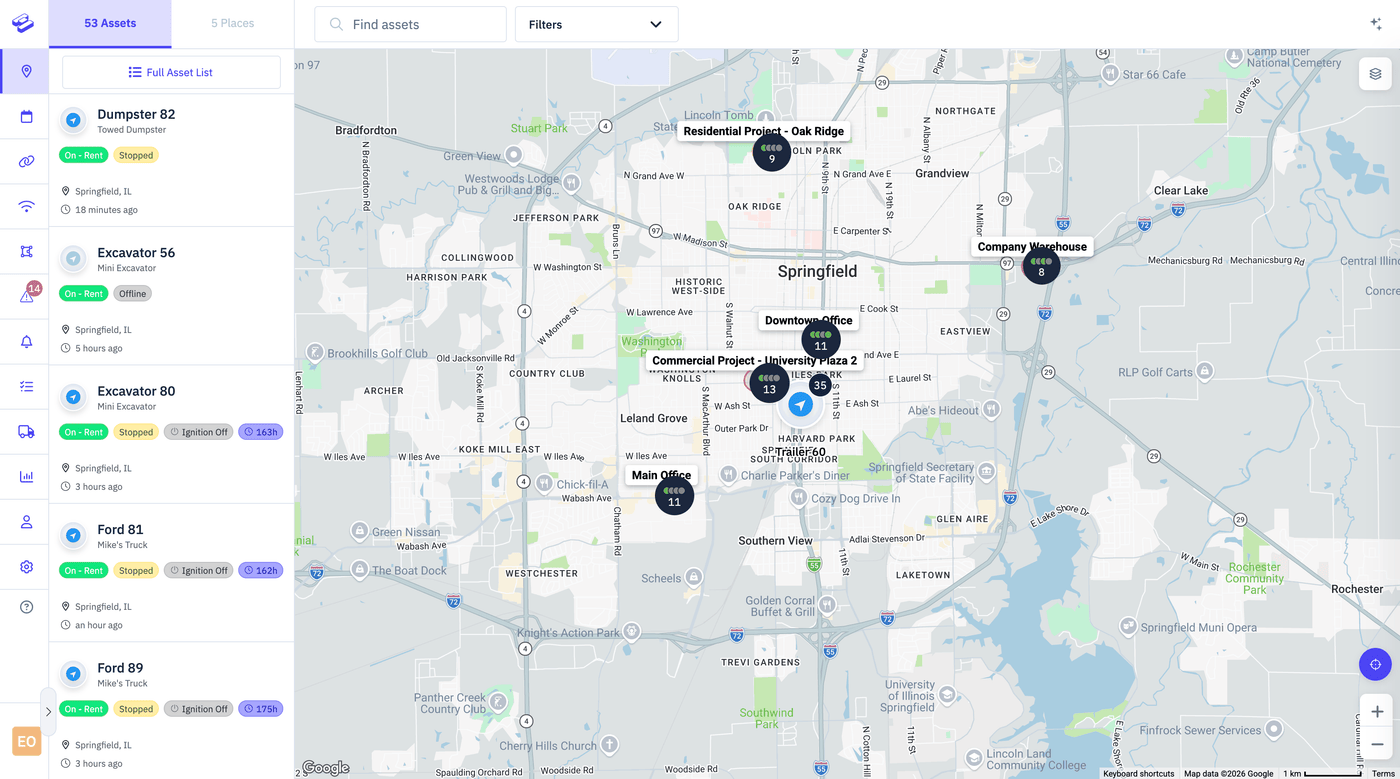
One live map. One list of what's wrong.
Every vehicle, trailer, and piece of equipment on one map, updating in 1–5 seconds. Zoom into a job site, filter to one crew, or watch the whole fleet at once.
Next to it, the Issues Dashboard shows everything that needs attention — speeding, geofence violations, maintenance due — prioritized in one view instead of scattered across your inbox.
- One map for vehicles, trailers, and equipment
- Filter by crew, branch, tag, or asset type
- Issues ranked by severity, not by the order they arrived

Geofences and alerts
Draw zones around job sites, yards, and customer properties. Get notified on entry, exit, after-hours movement, and speeding — by text, email, or push.
Job-site arrivals and time on site
Place Analytics records who arrived, when they left, and how long they stayed. Answer "how long were you at my house?" without calling the tech.
Update speed depends on hardware. Vehicle-connected trackers — OBD and hardwired — report in 1–5 seconds while driving. Battery trackers report on the interval you choose, and you can change that interval from the app. See Battery Reporting Modes below.
Customer ETA
Tell customers when you'll arrive.
Send a link that shows the customer your tech's live location and arrival window. No app, no account, and it expires after arrival.
One link answers “where's my tech?”
Create a Live Link, pick the vehicle, and text it to the customer. They open it in a browser and see the vehicle moving on a map, an arrival window, and a clock-time ETA that updates as the tech gets closer.
Fewer “is he still coming?” calls to the office, and a customer who's at the door when the van arrives.
- Live map and arrival window — no app, no login
- Call and text buttons so customers reach your office
- Expires after arrival or on the schedule you set
Set up in seconds
Name the link, choose one tracker or all of them, and set how long it should work. It's done from the dashboard — nothing for the customer to install.
Customers reach you, not the driver
Call and text buttons on the page go to your office. Customers can send over a gate code, where the unit is, pets, or parking notes before the tech pulls up.
Expires when you say
Links stop working after arrival or at the end time you set, so a customer never keeps a permanent window into your fleet.
Live Links work without an ETA too. Share a vehicle's location for a set window — with or without the last 48 hours of history — for a dispatcher, a customer, or a subcontractor who only needs to see one truck.
History
Understand what happened
One workflow, not a pile of reports. Pick a vehicle, pick a day, and watch it back.
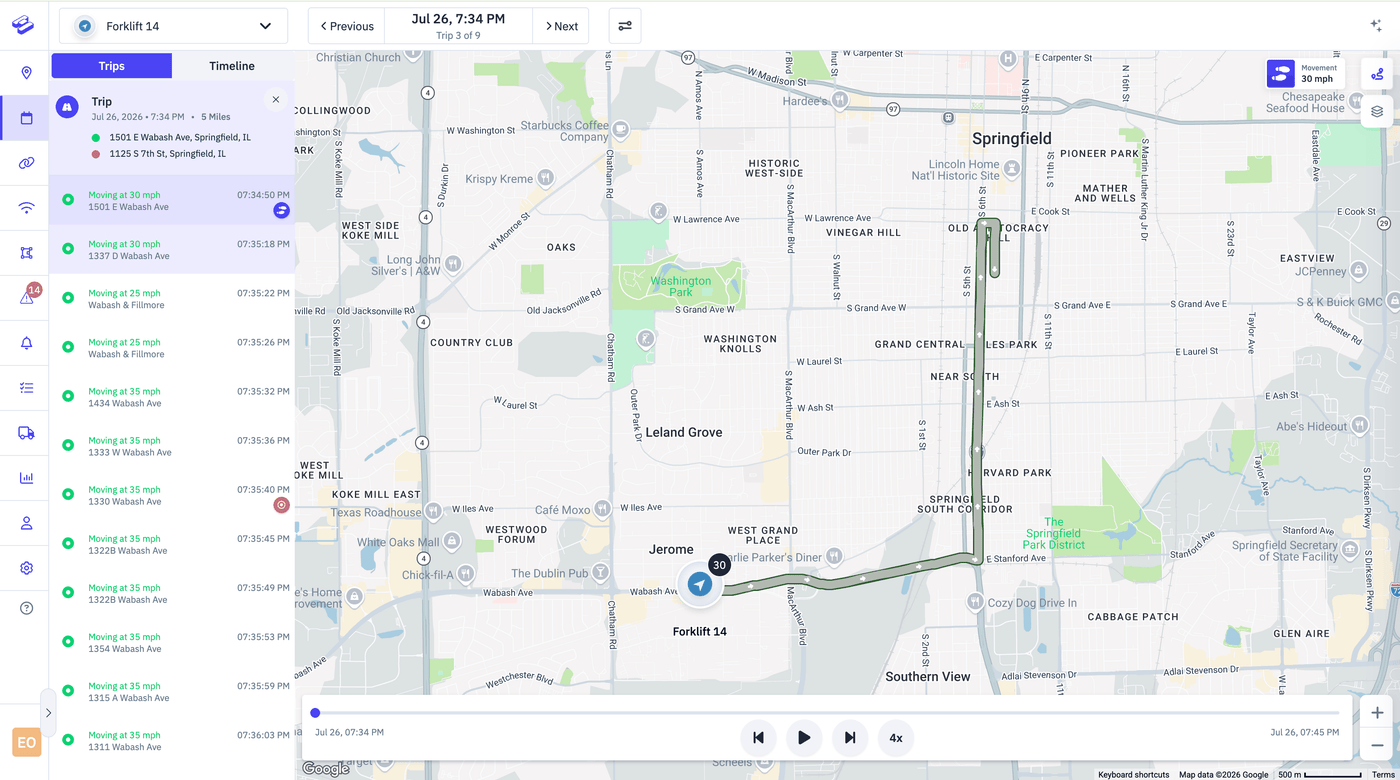
Replay any vehicle's day. Every trip, every stop, every event.
A customer says nobody showed up on Tuesday. Open Tuesday. The route draws itself — every trip start and stop, every address, every minute the engine sat idle.
You can see where the van actually went and how long it stayed, where it sped, which harsh braking and cornering events fired, and which alerts went out. Unexpected stops and route deviations stand out because the rest of the day looks normal.
Two minutes later you know whether to apologize to the customer or have a conversation with the driver.
- Trip-by-trip route replay with stop durations
- Speeding and harsh driving events plotted on the route
- Every alert that fired, in the order it fired
- Unexpected stops and route deviations against a normal day
Driver safety
Spot risky driving before it costs you.
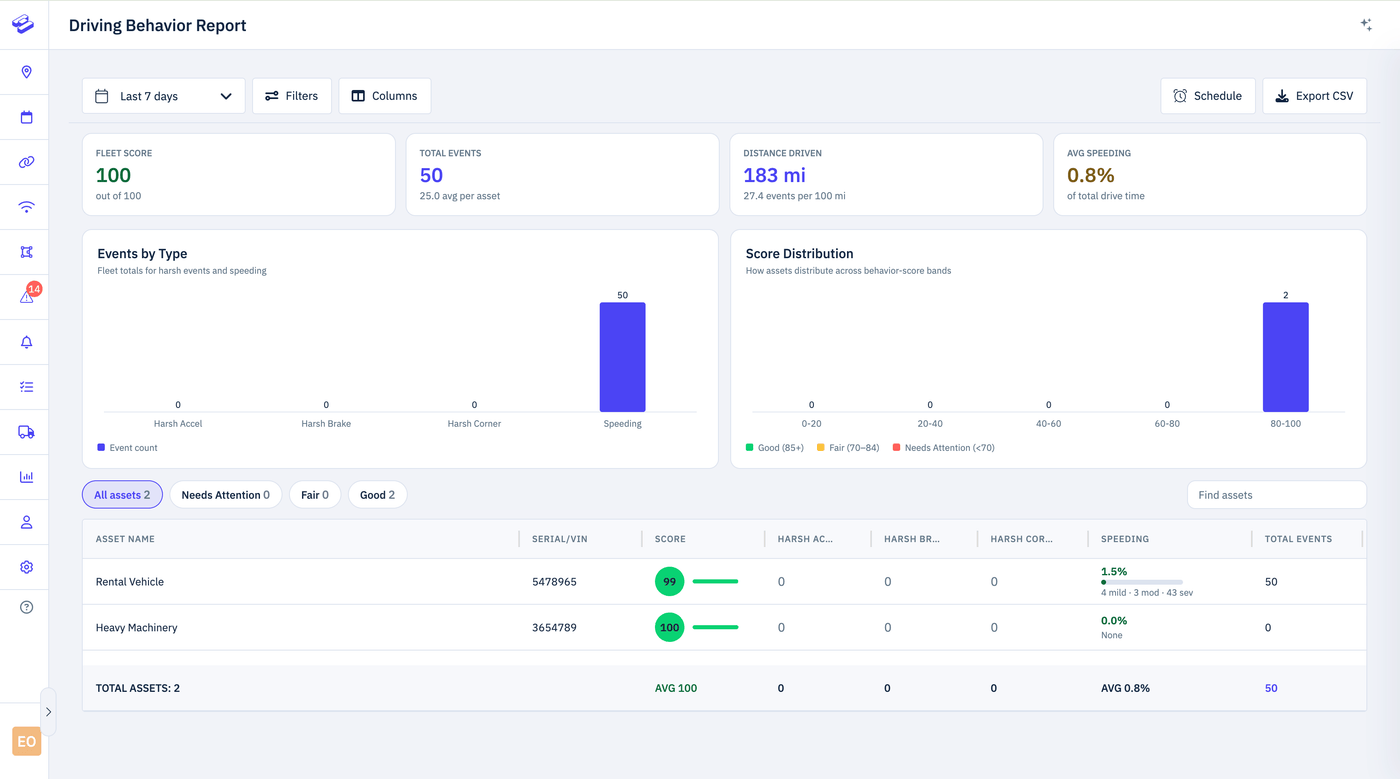
Every vehicle-connected tracker gives you a 0–100 behavior score built from harsh acceleration, harsh braking, harsh cornering, and speeding as a percentage of drive time. No camera required — an OBD or hardwired tracker is enough.
A score you can actually coach against
One number per vehicle, and one for the fleet. When a score drops you can see which behavior moved it and which trip it came from — so a coaching conversation starts with a specific Tuesday afternoon instead of a vague complaint.
The same scorecards are what you bring to an insurance conversation.
Fleet and per-vehicle scores
A 0–100 score for every tracked vehicle and a rolled-up score for the whole fleet.
Speeding frequency and severity
Speeding measured as a share of drive time and graded mild, moderate, or severe — so occasional 5-over doesn't read the same as habitual 20-over.
Trends over time
Watch a score move week over week to see whether coaching actually stuck.
Drill into the exact trip
Open any event to see the trip behind it: route, time, speed, and what happened around it.
Driver scorecard reports
Export or schedule scorecards for coaching sessions and insurance conversations.
Behavior scoring needs a vehicle-connected tracker — OBD, hardwired, or the AI Dash Cam. Battery and portable trackers report location, movement, trips, and location-based alerts, but not driving events.
Speeding is measured by comparing the vehicle speed your tracker records against mapped speed-limit data for the road it was on. The tracker doesn't read road signs.
Utilization
Know which vehicles and equipment earn their keep.
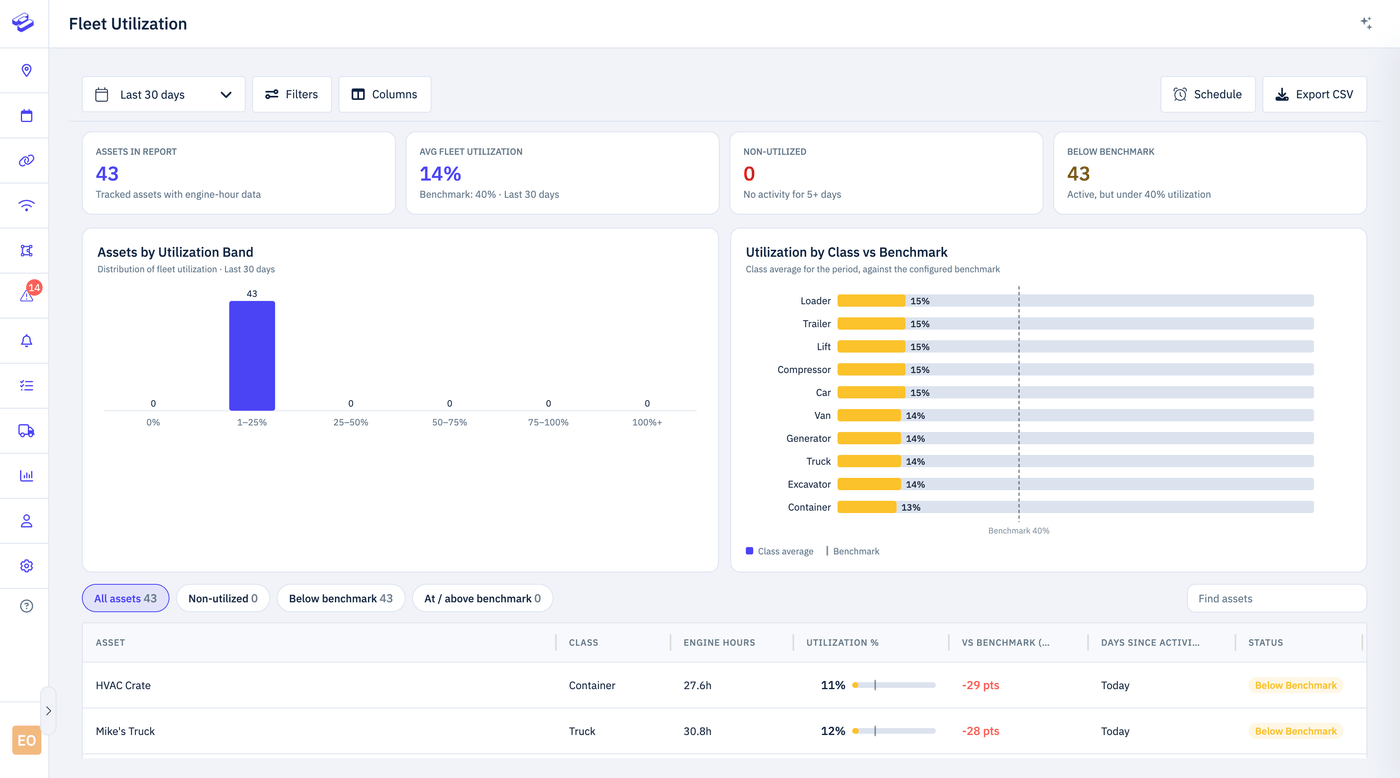
Engine hours and utilization percentage per asset, against a benchmark you set. Assets with no recent activity get flagged automatically.
What to redeploy, rent out, or sell — before you buy more
Set a benchmark for what "used enough" means in your business. Every vehicle and every piece of equipment is measured against it, so the trailer that's been parked behind the shop since March stops being invisible.
The next purchase decision starts here. Either you have an asset that's underused, or you have a real case for buying another one.
Utilization vs. your benchmark
Engine hours and utilization percentage per asset, measured against the threshold you set — not an industry average someone else picked.
Non-utilized flags
Assets with no recent activity get flagged automatically, after a number of idle days you configure.
Compare across the business
Break utilization down by branch, crew, asset type, or period to see where the slack actually is.
Engine hours come from vehicle-connected trackers and from the Pulse Engine equipment tracker. Battery and portable trackers report movement and location, not runtime.
Tags and groups are the organizing layer underneath all of this. Tag an asset once — by branch, crew, trailer, or equipment type — and that grouping carries through the map, geofences, alerts, utilization, and every report. Set it up here and the rest of the platform filters the way your business is actually organized.
See plans and pricing
Free tracker with every plan. No contracts. Cancel anytime.
Vehicle health
Catch waste and vehicle problems before they get expensive.
Fuel, maintenance, and diagnostics, read straight out of the vehicle by the OBD plug-in tracker.
Three things that quietly drain a service fleet
Fuel burned while parked. A service that slipped past due. A fault code the driver ignored for a week. None of these announce themselves — they show up later as a bigger bill.
The OBD plug-in tracker reads all three straight from the vehicle and surfaces them on the same dashboard you already check.
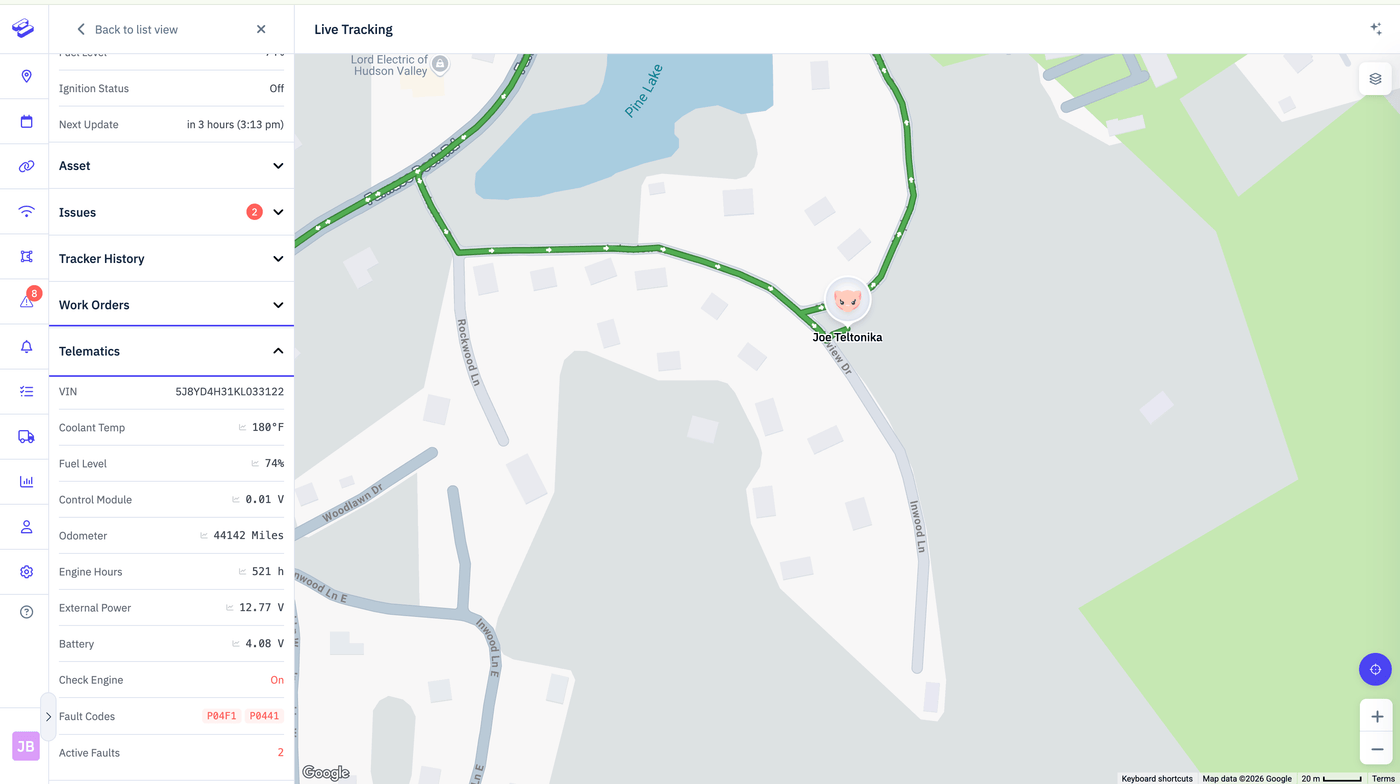
Fuel usage
Consumption per vehicle, plus fuel burned at idle — so you can see what's being spent going nowhere.
Preventive maintenance
Set triggers on engine hours, odometer, or dates. Get alerted before a service is overdue, not after.
Fault codes and diagnostics
DTC codes and vehicle health surface as they occur, so a problem reaches you before the driver mentions it.
Fuel and diagnostics come from the OBD port, so they need the OBD plug-in tracker and a supported vehicle. Hardwired trackers are a permanent install and support every maintenance trigger — mileage, engine hours and dates. Set the starting odometer once and Spytec tracks distance travelled from there; engine hours are measured from ignition-on time. Battery and portable trackers report location, movement, trips, and location-based alerts — not engine data.
Scout AI
Ask your fleet. Get an answer.
Scout makes fleet analysis and setup accessible to someone who is not a fleet analyst.
Type a question. Scout does the work.
Scout flags unusual activity, builds reports, and creates alerts in plain English. Ask what changed yesterday and it tells you. Ask for a weekly mileage report and it builds one. Ask it to alert you when the service trucks speed and it sets that up.
No report builder to learn first.
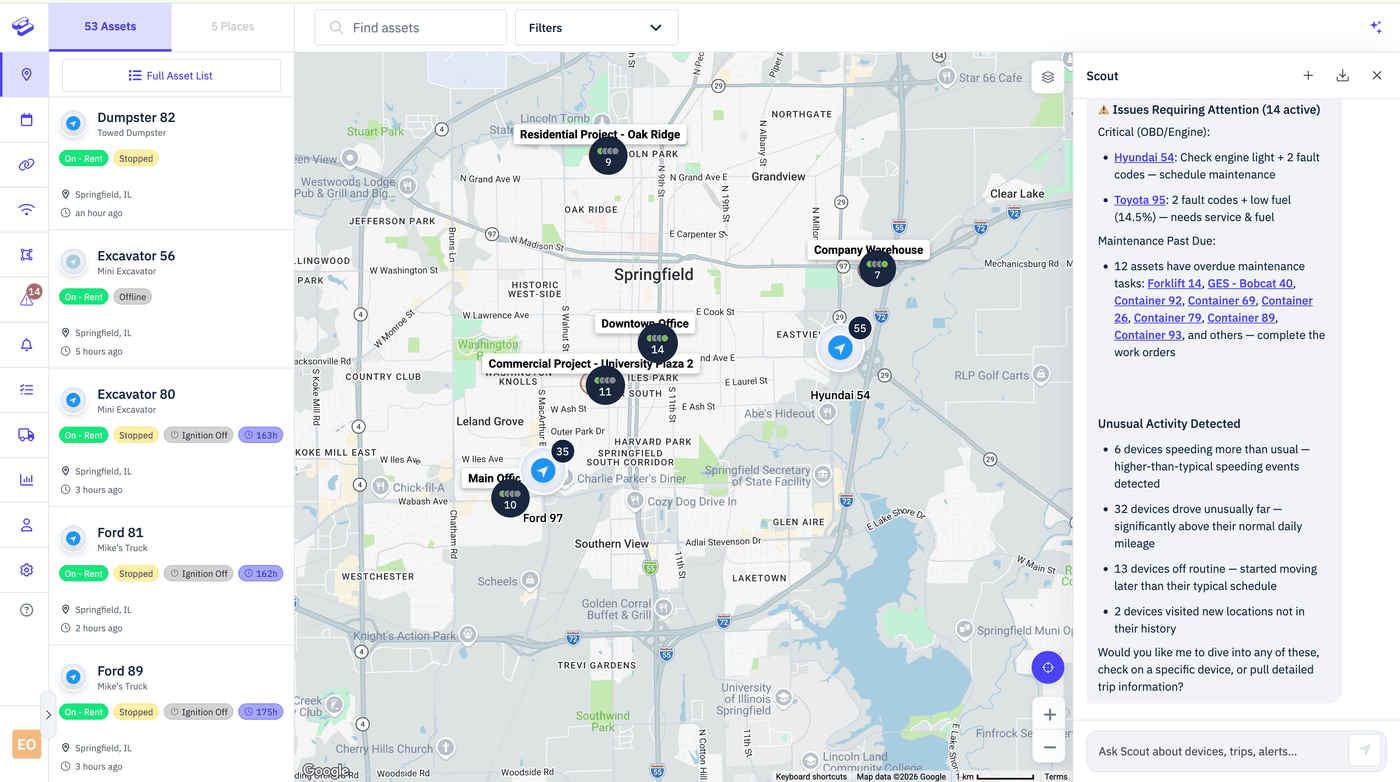
Reporting is what happens after the question. Ask Scout, investigate what it surfaces, save the view as a report, then schedule it so you stop having to ask.
Custom Report Builder
Pick the data points, filters, and groupings you care about, then save the result as a report you can rerun.
Report templates
Mileage summaries, trip logs, driver scorecards, idling, and utilization are ready to run out of the box.
Scheduled delivery
Set a report to run daily, weekly, or monthly and land in the right inbox — including people who never log in.
Vehicles and equipment
Track everything, tune everything.
Service vehicles, trailers, powered equipment, and unpowered assets in one platform — one account, one map, one app.
Does the asset have power? That decides the tracker.
The question is simply whether the asset has its own power. Vans and trucks plug in or wire in. Powered equipment takes the Pulse Engine tracker and reports engine hours. Trailers, containers, and attachments — anything with nothing to tap — take a battery tracker.
They all land on the same map, in the same groups, in the same reports. You don't run one system for the fleet and a second one for the yard.
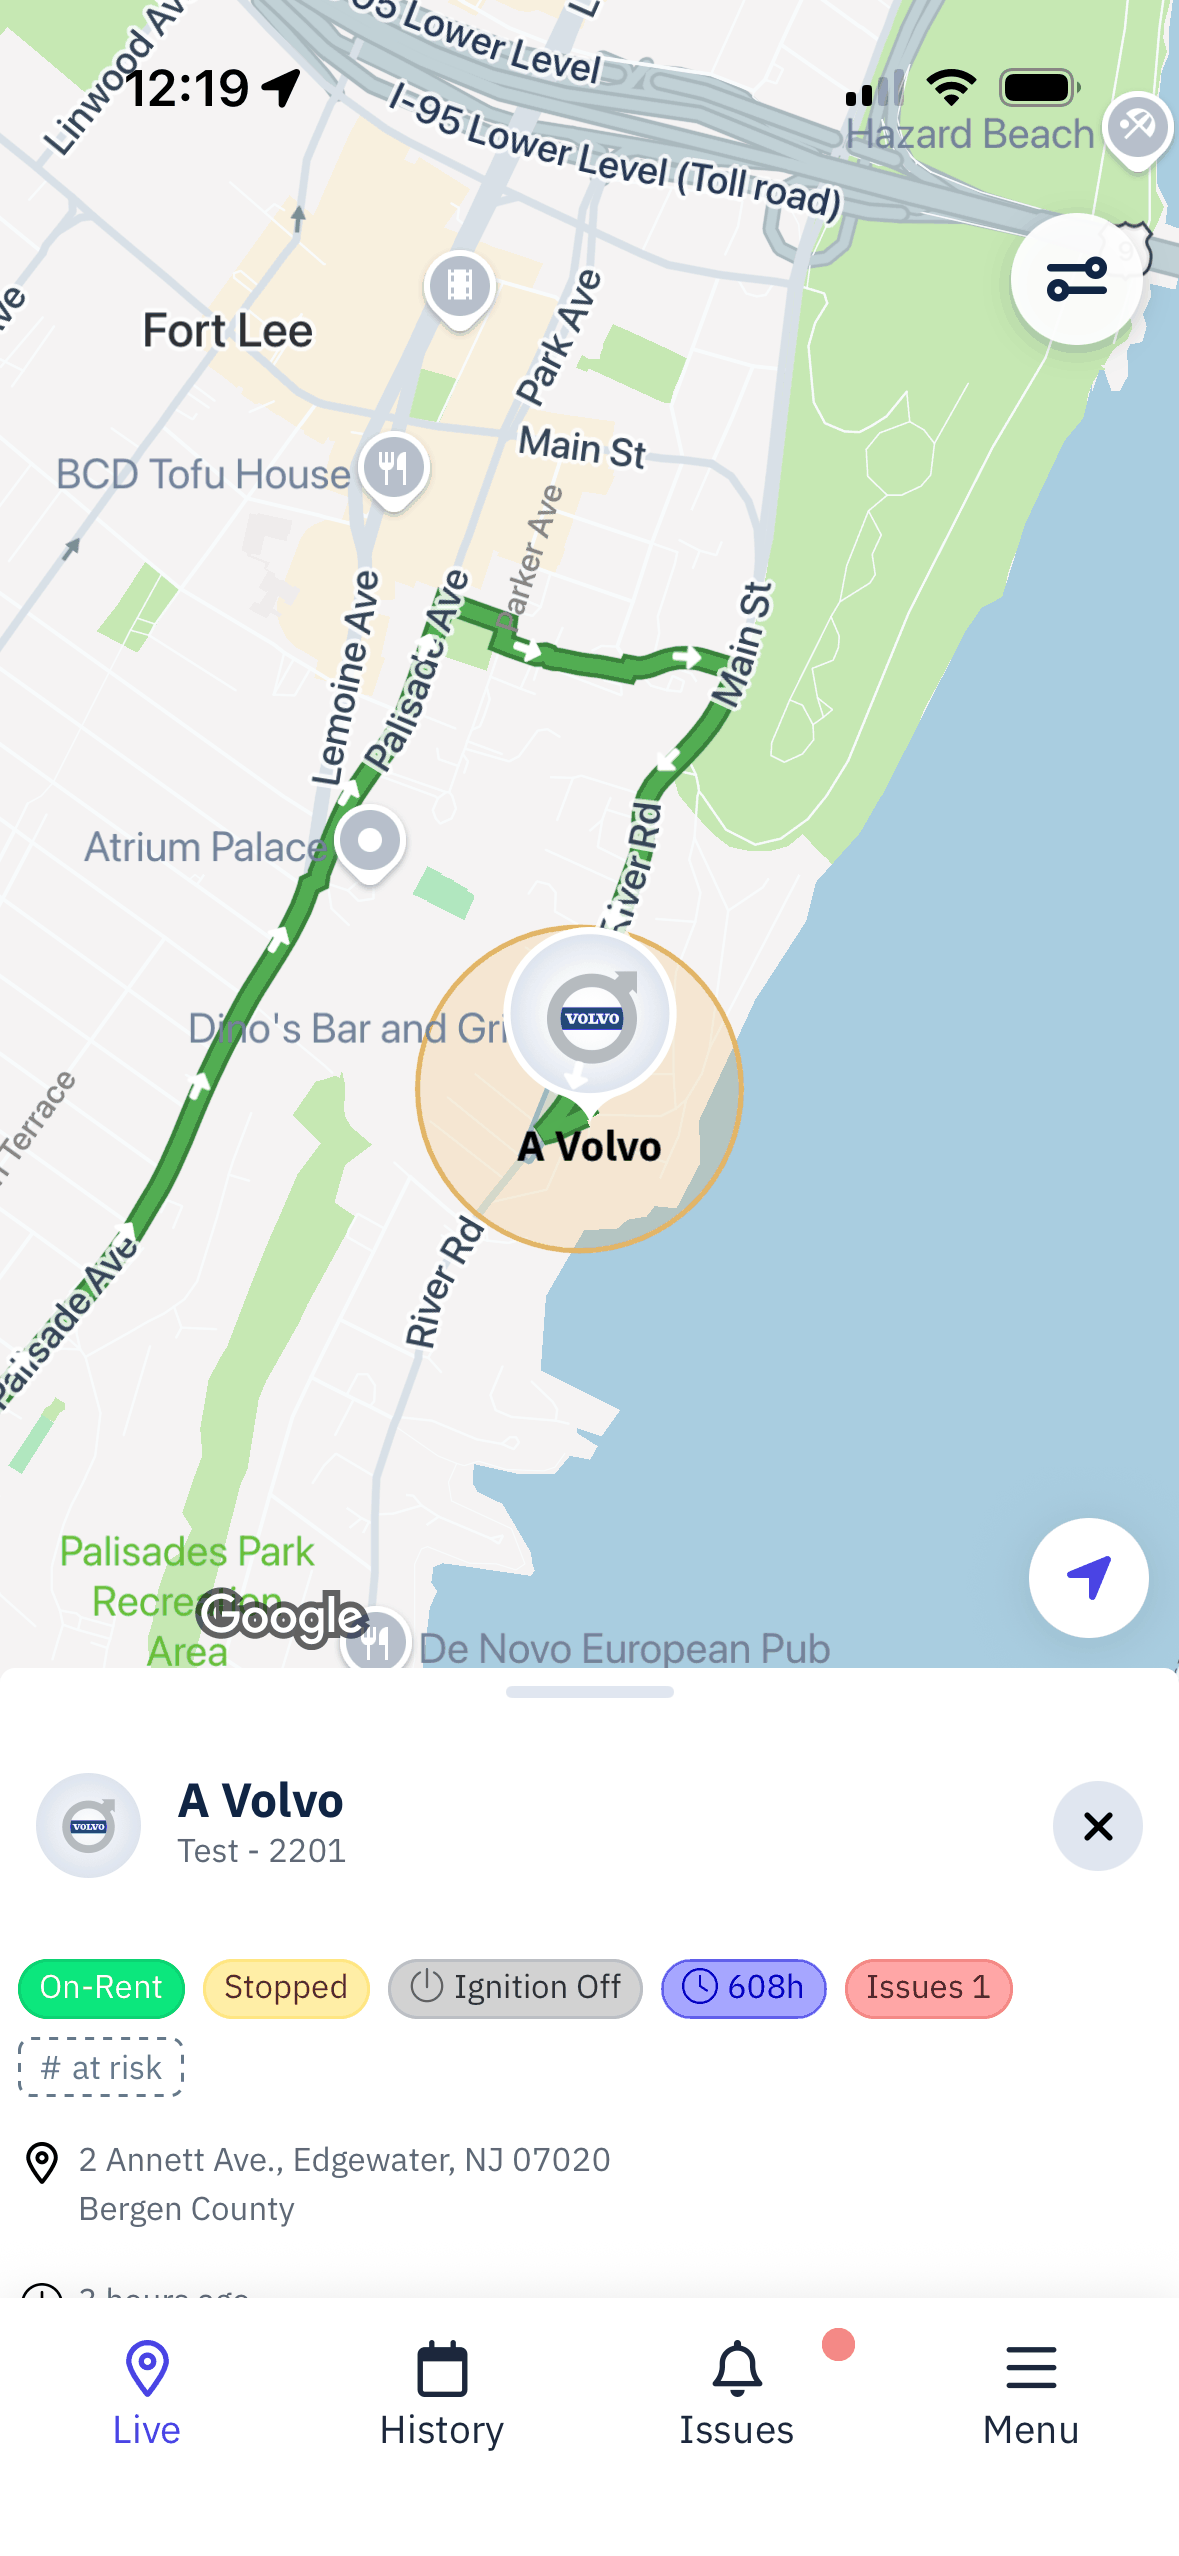
Battery Reporting Modes
Choose faster reporting when visibility matters, or stretch battery life for assets that rarely move. Change modes over the air from the mobile app — no retrieving the device, no site visit.
Service vehicles
OBD plug-in for fuel and diagnostics, or hardwired for a permanent install. Both report location, trips, driving events, odometer and engine hours, and both support Customer ETA and every maintenance trigger.
Powered equipment
Generators, skid steers, light towers — anything running its own engine. The Pulse Engine tracker reports runtime hours, so utilization is measured rather than guessed.
Trailers and unpowered assets
Trailers, containers, attachments, and tool carts. A battery tracker goes on the asset and reports on the schedule you set — nothing to wire into.
Choose a tracker
Which tracker do you need?
Enough to pick hardware — not a full spec sheet. Every feature above carries the same badges, so you can work backwards from what you need to the device that does it.
| What you need | Battery / Portable | OBD Plug-In | Hardwired | AI Dash Cam | Pulse Engine |
|---|---|---|---|---|---|
| Tracks vehicles | Included | Included | Included | Included | Not available |
| Tracks equipment & trailers | Included | Not available | Included | Not available | Included |
| Battery-powered (nothing to wire into) | Included | Not available | Not available | Not available | Not available |
| Powered by the asset (plug-in or hardwired) | Not available | Included | Included | Included | Included |
| Driver behavior scoring | Not available | Included | Included | Included | Not available |
| Engine hours & utilization | Not available | Included | Included | Included | Included |
| Fuel & diagnostic data | Not available | Included | Not available | Not available | Not available |
| Video / camera events | Not available | Not available | Not available | Included | Not available |
| Always-on high-frequency reporting | Device-dependent | Included | Included | Included | Device-dependent |
Mixed fleet? Most businesses run more than one type — vehicles on OBD or hardwired, trailers and equipment on battery.
Compare all trackers →Ready to pick your hardware?
Free tracker with every plan. Free 2-day shipping. 30-day money-back guarantee.
Platform foundation
The parts you only notice when they fail
SuperSim carrier switching
Trackers automatically switch between AT&T, T-Mobile, and Verizon based on signal strength. Basements, rural routes, and dead zones get the best available network instead of whichever one you were locked into.
99.9% platform uptime
Redundant servers across multiple data centers. Your dashboard doesn't go dark when one of them does.
Roles and granular permissions
Admins see everything. Dispatchers see location and status. Drivers see their own vehicle. Permissions are set per feature, not just per role.
Audit trail
Who logged in, what they viewed, and what they changed.
Full REST API and webhooks for dispatch, CRM, and payroll.
Questions before you buy
Can I track vehicles, trailers, and equipment in one account?
Yes. Vehicles, trailers, powered equipment, and unpowered assets all live in the same account, on the same map, in the same reports. You pick the right tracker for each asset type — there's no separate system or separate login for the yard.
Which features depend on the tracker I choose?
Location, trips, history, geofences, and alerts work on every tracker. Driver behavior scoring needs a vehicle-connected tracker — OBD, hardwired, or the AI Dash Cam. Fuel and diagnostics need the OBD plug-in specifically. Engine hours come from vehicle-connected trackers and the Pulse Engine equipment tracker. Video events need the AI Dash Cam. Every feature on this page carries a badge showing which hardware it needs.
Does driver behavior scoring require a dash cam?
No. An OBD or hardwired tracker is enough — behavior scoring is built from harsh acceleration, harsh braking, harsh cornering, and speeding as a percentage of drive time, all read from the vehicle. A dash cam adds video to the picture, but it isn't required to score or coach drivers. Battery and portable trackers don't support behavior scoring.
Can I change a battery tracker's reporting rate remotely?
Yes, from the mobile app. Switch to faster reporting when you need visibility, or stretch battery life for an asset that rarely moves. You don't have to retrieve the device or send someone to the site.
What vehicle-health data can I see?
With the OBD plug-in tracker in a supported vehicle: fuel consumption including fuel burned at idle, diagnostic trouble codes as they occur, and battery voltage. Odometer and engine hours feed maintenance triggers. Hardwired trackers are a permanent install that supports every maintenance trigger — mileage, engine hours and dates — but not fuel level or fault codes, which need the OBD port. Battery and portable trackers report location, movement, trips, and location-based alerts rather than engine data.
Do I need a contract?
No. Plans are month-to-month and you can cancel anytime. Annual billing is $8.95 per vehicle per month, monthly billing is $14.95 per vehicle per month, and a tracker is included free with every plan. There's a 30-day money-back guarantee and free 2-day shipping.
How do I choose the right tracker?
Start with what you're tracking. Vehicles you want engine data from: OBD plug-in or hardwired. Trailers and powered equipment: hardwired or battery. Anything with no power source: battery. Safety and liability video: the AI Dash Cam. The comparison table above narrows it down in about thirty seconds.
Every feature, in one list
The complete list, for the checklist-makers.
Tracking
Live fleet map
Every asset on one map, updating in 1–5 seconds on vehicle-connected trackers.
Trip history and route replay
Replay any day trip by trip, with stop locations and durations.
Stop and idle detection
Every stop logged with how long the asset sat there.
Geofences
Draw zones around job sites, yards, and customer properties.
Place Analytics
Arrivals, departures, and time on site per location.
Live Links
Expiring shareable live-location link for customers, no login required.
Tags and groups
Organize by branch, crew, or asset type — filters carry across maps, alerts, and reports.
Battery reporting modes
Change reporting frequency over the air from the mobile app.
Mobile apps (iOS and Android)
Full tracking, alerts, and settings from the phone.
Alerts
Issues Dashboard
Everything that needs attention, prioritized in one view.
Geofence entry and exit alerts
Notified when an asset enters or leaves a zone you drew.
After-hours movement alerts
Flag movement outside the hours you define.
Speeding alerts
Thresholds you set, with severity grading.
Delivery by text, email, and push
Route each alert to the people who should act on it.
Conditional alert rules
Different thresholds by vehicle, group, or time of day.
Low battery alerts
Know before a battery tracker goes quiet.
Driver Safety
0–100 behavior score
Per vehicle and rolled up for the fleet. No camera required.
Harsh acceleration, braking, and cornering
Events detected and plotted on the trip they happened in.
Speeding as a share of drive time
Graded mild, moderate, or severe rather than a raw count.
Behavior trends over time
Week-over-week movement to see whether coaching stuck.
Driver scorecard reports
Exportable and schedulable for coaching and insurance conversations.
Video incident events
Camera-detected incidents attached to the trip.
Utilization
Engine hours per asset
Runtime totals used for utilization and maintenance triggers.
Utilization vs. benchmark
Percentage against a threshold you set, per asset.
Non-utilized asset flags
Automatic flag after a configurable number of idle days.
Comparisons by branch, crew, or type
Break utilization down the way the business is organized.
Mileage totals
Distance per vehicle over any period.
Vehicle Health
Fuel consumption
Usage per vehicle, read from the vehicle.
Idle fuel waste
Fuel burned while the vehicle isn't going anywhere.
Preventive maintenance triggers
Schedules based on engine hours, odometer, or dates.
Maintenance due alerts
Notified before a service goes overdue.
Fault codes (DTC)
Diagnostic trouble codes surfaced as they occur.
Battery voltage monitoring
Vehicle battery health surfaced from the connection.
Reports
Custom report builder
Choose data points, filters, and groupings, then save the report.
Report templates
Mileage, trip logs, driver scorecards, idling, and utilization out of the box.
Scheduled delivery
Daily, weekly, or monthly reports emailed automatically.
Export to CSV
Take any report into a spreadsheet or accounting system.
Scout AI
Natural-language questions
Ask about your fleet in plain English and get an answer.
Unusual activity detection
Scout flags activity that doesn't match a normal day.
Report building from a prompt
Describe the report you want and Scout builds it.
Alert setup from a prompt
Describe the alert you want and Scout configures it.
Platform & Admin
SuperSim multi-network connectivity
Automatic switching between AT&T, T-Mobile, and Verizon on signal strength.
99.9% platform uptime
Redundant servers across multiple data centers.
Roles and granular permissions
Control access per feature, not just per role.
Audit trail
Logins, views, and changes recorded for accountability.
REST API
Location, history, geofence, and report endpoints.
Webhooks
Push events into dispatch, CRM, or payroll as they happen.
24/7 US-based support
Real people, included with every plan.