The US commercial fleet industry includes more than 8 million medium- and heavy-duty vehicles, plus tens of millions of light-duty vehicles used commercially — and most of them belong to small operators running fewer than 50 units. HVAC companies, plumbers, landscapers, roofers, delivery operators, and service contractors make up the bulk of US small fleets, and the data below is specifically curated for those owners.
This guide compiles 30+ fleet management statistics for 2026 — covering costs, fuel, theft, safety, insurance, maintenance, and ROI — with a focus on fleets under 50 vehicles. Figures are drawn from industry surveys, telematics providers, federal data sources (NHTSA, FMCSA, NICB), insurance benchmarks, and analyst research.
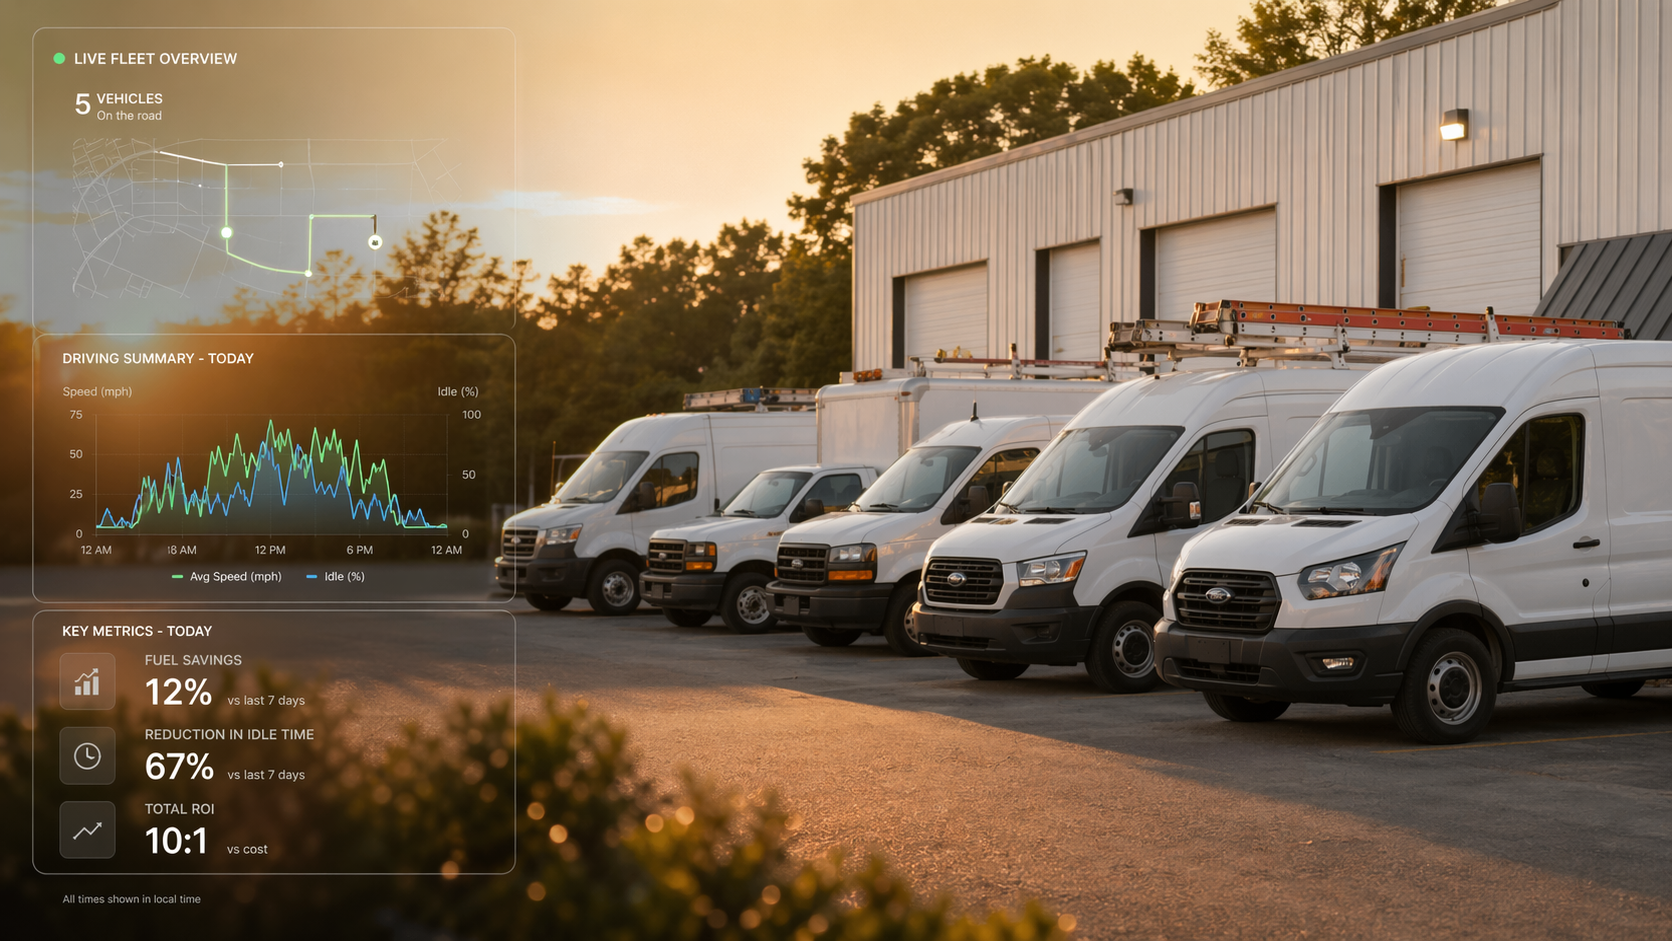
Spytec GPS is a self-serve GPS tracking platform for small and mid-size fleets, with plans starting at $8.95/vehicle/month and no long-term contracts. We compiled this resource because the fleet owners we talk to rarely get straight answers on what telematics actually delivers. What's below is the data — stripped of marketing spin.
Top fleet management statistics 2026: at a glance
The ten numbers every small fleet owner should know heading into 2026:
- Small fleets under 50 vehicles make up roughly 85% of US commercial fleets; fleets under 10 vehicles account for about 70%.
- GPS fleet tracking adoption sits at ~67% across commercial fleets, but drops to 40–50% for fleets under 10 vehicles.
- Telematics typically reduces fuel consumption by 10–15% within the first year.
- Idling alone wastes roughly $3,500–$4,500 per vehicle per year in a typical service fleet.
- Commercial auto insurance premiums rose ~10% in 2024 and are projected to rise again through 2026.
- AI-enabled dash cams reduce at-fault accident claims 20–40% in insurer case studies.
- Nuclear verdicts ($10M+) in commercial driving litigation are up roughly 300% over the last decade.
- More than 1 million vehicles were stolen in the US in 2023 — the highest total since 2008.
- Unplanned repairs cost 3–5x more than scheduled maintenance work.
- Most small fleets recoup their telematics investment within 6–12 months.
The US small fleet market in 2026
Total US commercial vehicles: The US Department of Energy estimates roughly 8 million Class 3–8 commercial vehicles on the road, on top of tens of millions of light-duty vehicles used commercially by service businesses.
Small fleets dominate: According to FMCSA motor carrier registration data, roughly 85% of registered commercial operators run fleets of 50 or fewer vehicles, and about 70% operate fewer than 10. These are the HVAC shops, plumbing companies, landscaping crews, and local delivery operators that power the US service economy.
Service industry concentration: Fleet-operating service businesses — HVAC, plumbing, landscaping, pest control, roofing, electrical, delivery, pool service, and construction — collectively run several million commercial vehicles. See our breakdown of fleet tracking by industry for vertical-specific data.
Fleet telematics market size: The global fleet telematics market was estimated at ~$27 billion in 2024 and is projected to grow at roughly 12% CAGR through 2030, per multiple industry analyst reports. North America accounts for the largest regional share.
The takeaway: The small fleet segment is the largest and fastest-growing slice of the commercial telematics market — and the segment most underserved by legacy enterprise vendors like Samsara, Motive, and Verizon Connect.
Fleet tracking adoption statistics
Overall adoption: Roughly 67% of commercial fleets use some form of GPS fleet tracking, according to Verizon Connect's Fleet Technology Trends Report. Adoption has grown every year since 2018.
Adoption by fleet size: Large fleets (100+ vehicles) show adoption above 80%. Small fleets under 10 vehicles sit closer to 40–50%, meaning roughly half of small operators still run without telematics heading into 2026.
Productivity improvement: 85% of fleet managers with GPS tracking say it improved productivity.
Time to ROI: 71% of fleets that install tracking report recouping their investment within the first 12 months.
Primary adoption drivers: Fuel costs and driver productivity are consistently cited as the top two reasons operators adopt fleet tracking, followed by customer service improvement and insurance savings.
Why small fleets lag: Many small operators assume GPS tracking requires 3-year contracts, equipment purchases, and installation fees — all true for legacy providers. Self-serve, no-contract options (like Spytec, with a free tracker and 30-day money-back guarantee) have only become standard in the last few years. For a comparison, see the 5 best fleet tracking systems for small service businesses in 2026.
Fuel and operating cost statistics
Fuel as a share of operating costs: Fuel averages ~24% of total fleet operating costs, per the American Transportation Research Institute's annual cost of trucking report. For light-duty service fleets, the share typically runs 15–25% depending on route density and vehicle class.
Fuel savings from GPS tracking: Industry averages show 10–15% fuel reduction within the first year of telematics adoption. Fleets with significant route waste or excessive idling routinely see savings above 20%.
Idling cost: A typical service vehicle idles 1,500+ hours per year. At current fuel prices, that's roughly $3,500–$4,500 per vehicle per year in wasted fuel — before accounting for accelerated engine wear and added maintenance cost.
Route optimization impact: Dispatching the closest available tech typically cuts daily drive time by 15–20% and fuel use proportionally. For industries with emergency calls (like plumbing and HVAC), the gain is usually larger.
Unauthorized use: Telematics providers report that GPS tracking cuts after-hours and off-route vehicle use by 30–40% within 90 days of install.
Per-vehicle fuel savings example: A service van driving 25,000 miles/year at 18 mpg and $3.60/gal spends about $5,000/year on fuel. A 12% reduction = ~$600/vehicle/year in fuel savings alone. For a 10-vehicle fleet, that's $6,000/year — before factoring in overtime, insurance, or theft.
→ See fleet tracking plans starting at $14.95/mo per vehicle
Time theft and productivity statistics
US business losses from time theft: US businesses lose an estimated $50 billion per year to employee time theft, per American Payroll Association data. Service fleets are disproportionately exposed because supervisors can't physically see drivers on the road.
Time padding prevalence: Surveys consistently find that ~43% of hourly workers admit to exaggerating hours worked at some point during their careers.
Average daily slack time: In service fleets without GPS tracking, internal audits commonly find 30–60 minutes of unaccounted time per driver per day — long lunches, extended breaks, and unscheduled personal stops.
Overtime reductions: Fleets that adopt GPS tracking typically cut unplanned overtime 15–25% within the first six months by exposing inefficient routing and inflated timesheets.
Timesheet disputes: GPS timestamp data resolves he-said/she-said disputes over start times, end times, and job duration — typically eliminating timesheet disputes entirely within the first billing cycle.
Take-home truck abuse: Roughly 15–20% of service fleet operators report active suspicions of after-hours side jobs or moonlighting. GPS data resolves these situations in days, not months. More on the take-home truck problem.
Vehicle theft and recovery statistics
Total US vehicle theft: More than 1 million vehicles were stolen in the US in 2023, per the National Insurance Crime Bureau (NICB) — the highest annual total since 2008. 2024 and 2025 continued elevated theft rates.
Commercial vehicle theft trend: Theft of work vans, box trucks, and utility vehicles has risen year-over-year since 2020, driven by rising used-truck values and catalytic converter theft. Service fleets with distinctive branding are increasingly targeted.
Recovery rate without GPS: The national average recovery rate for stolen vehicles is roughly 34%, per NICB data. Most unrecovered vehicles are stripped for parts within 48 hours.
Recovery rate with GPS: Vehicles equipped with active GPS trackers have recovery rates well above 80%, and most are recovered within 24 hours — often before the owner even files a police report.
Replacement cost: Replacing a single stolen work van at 2026 prices typically runs $35,000–$65,000, plus lost revenue during replacement. One recovered vehicle can pay for years of fleet-wide GPS tracking.
Tool and equipment theft: Tool and equipment theft is a separate and growing issue. Asset-level GPS trackers on trailers, generators, compressors, and job boxes are increasingly common on service fleets — and recovery rates mirror vehicle recovery rates.
Commercial auto insurance and safety statistics
Premium increases: Commercial auto insurance premiums rose ~10% in 2024, following increases of approximately 9% in 2023 and 8% in 2022 (CIAB Commercial P/C Market Index). Small fleets frequently see double-digit annual hikes as carriers tighten underwriting.
Nuclear verdicts: Verdicts of $10 million or more against trucking and commercial driving defendants are up roughly 300% over the last decade, per the US Chamber Institute for Legal Reform. Plaintiff attorneys increasingly specialize in commercial crash litigation.
Average crash cost: The average cost of a non-fatal commercial vehicle crash exceeds $100,000 (FMCSA/NHTSA). Fatal crashes average well over $1 million once litigation, lost productivity, and insurance impact are included.
Distracted driving: Distracted driving contributes to roughly 8% of all fatal US crashes, per NHTSA FARS data. The proportion is often higher for commercial drivers managing phones, tablets, and paperwork in-cab.
Speeding: Speeding is a factor in ~29% of fatal crashes (NHTSA). Telematics speed alerts and in-cab coaching typically cut speeding incidents materially within the first 90 days of deployment.
Dash cam impact on claims: Insurer case studies consistently show at-fault claim reductions of 20–40% in fleets that adopt AI-enabled dual-camera dash cam systems. The Spytec Pulse Vision AI Dash Cam combines road-facing and driver-facing video with real-time incident alerts and GPS tracking in a single device.
Insurance discounts: Many commercial auto carriers now offer 5–15% premium credits for fleets running qualifying telematics and/or dash cam systems. Specific discount amounts vary by carrier and risk profile.
Fault determination: In ambiguous crash situations, dash cam video shifts fault determination in the fleet's favor in a majority of disputed incidents — compressing what used to be 12–24 months of liability disputes into days.
Fleet maintenance statistics
Preventive vs. reactive cost ratio: Unplanned repairs cost 3–5x more than scheduled maintenance work, per vehicle lifecycle studies from the American Trucking Associations. The gap widens as fleets age.
Downtime cost: Every day a service vehicle is out of commission costs $400–$800 in lost revenue for a typical small fleet, depending on industry. For HVAC and plumbing fleets during peak season, daily downtime cost can exceed $1,500 per vehicle.
Telematics maintenance savings: Fleets using telematics-based maintenance reminders — mileage-triggered oil changes, engine diagnostic alerts, tire rotation schedules — cut overall maintenance costs approximately 14%, per ABI Research estimates.
Inspection compliance: Electronic DVIR and inspection workflows reduce roadside inspection violations 20–30% compared to paper-based systems.
Engine diagnostic capture: OBD-connected fleet trackers capture engine fault codes in real time, catching issues like low oil pressure, overheating, and failing sensors before they turn into expensive breakdowns.
ROI: what small fleets actually save with GPS tracking
Here's the bottom-line math for a small service fleet running 10 vehicles, based on the ranges above:
- Fuel savings: 10–15% × ~$6,000/vehicle fuel spend = $6,000–$9,000/year across the fleet
- Overtime reduction: 15–25% × ~$8,000/vehicle overtime spend = $12,000–$20,000/year
- Insurance savings: 5–10% premium credit on a $30,000 premium = $1,500–$3,000/year
- Theft recovery: Avoiding a single stolen vehicle = $35,000–$65,000 saved once per fleet's operating history
- Productivity: One extra billable job per tech per week × 10 techs = $50,000+/year in recovered revenue for most service businesses
Telematics cost for a 10-vehicle fleet: On Spytec's annual plan, a 10-vehicle fleet runs $89.50/month ($8.95/vehicle/month) — about $1,074/year. That's against documented annual savings typically running 10–20x that.
Time to breakeven: Most small fleets cover the annual cost of GPS tracking within the first 30–60 days from fuel savings alone.
Pricing comparison: Samsara, Motive, and Verizon Connect typically require 3-year contracts and end up costing $30–$60/vehicle/month once hardware fees, installation, and platform fees are included. Spytec's pricing is $14.95/vehicle/month monthly or $8.95/vehicle/month annual, with a free tracker included in every plan, no contracts, 2-day shipping, and a 30-day money-back guarantee.
Ready to put these numbers to work for your fleet?
Free tracker with every plan. No contracts. Ships in 2 days. 30-day money-back guarantee.
Shop Fleet Trackers →Frequently asked questions about fleet management statistics
What percentage of small fleets use GPS tracking in 2026?
Roughly 40–50% of commercial fleets under 10 vehicles use GPS tracking in 2026, compared to ~80% of fleets with 100+ vehicles and ~67% across all commercial fleets. Adoption among small fleets has been accelerating as self-serve, no-contract options replace legacy enterprise telematics platforms.
How much can a small fleet save with GPS tracking?
A typical 10-vehicle service fleet saves $15,000–$30,000 per year through fuel reduction, overtime cuts, insurance discounts, and theft prevention. On Spytec's $8.95/vehicle/month annual plan, that same fleet pays about $1,074/year for tracking — a 10–20x return on investment in the first year.
How much do commercial auto insurance rates rise each year?
Commercial auto insurance premiums rose approximately 10% in 2024 and 9% in 2023, per the CIAB Commercial P/C Market Index. Fleets with documented safety programs — including dash cams and telematics — frequently qualify for 5–15% carrier discounts that offset rate increases.
How many vehicles are stolen in the US each year?
More than 1 million vehicles were stolen in the US in 2023, per the National Insurance Crime Bureau — the highest total since 2008. Vehicles equipped with active GPS trackers are recovered at rates above 80%, compared to a national average near 34% for unprotected vehicles.
Do dash cams actually reduce accident claims?
Insurer case studies consistently show 20–40% reductions in at-fault claims for fleets that adopt AI-enabled dual-camera systems with real-time coaching. Most major commercial auto carriers now offer premium credits for qualifying dash cam installations, and video evidence resolves ambiguous crash disputes in the fleet's favor in a majority of incidents.
What's the average fuel savings from GPS fleet tracking?
Industry averages show 10–15% fuel reduction within the first year of GPS tracking adoption. Savings come from reduced idling, route optimization, and elimination of unauthorized vehicle use. Fleets with significant existing route waste frequently see fuel savings above 20%.
How long does it take to see ROI on GPS fleet tracking?
71% of fleets that install GPS tracking report full payback within the first 12 months, and most small fleets cover the cost of tracking within 30–60 days from fuel savings alone. Faster ROI is typical for fleets with existing theft, overtime, or route-inefficiency problems.
Data sources and methodology: Statistics in this post are compiled from public industry research including the Verizon Connect Fleet Technology Trends Report, American Transportation Research Institute (ATRI) annual cost of trucking reports, CIAB Commercial P/C Market Index, FMCSA and NHTSA federal data, National Insurance Crime Bureau (NICB) annual vehicle theft reports, American Payroll Association surveys, US Chamber Institute for Legal Reform research, and ABI Research fleet telematics coverage. Figures are cited as representative ranges across recent years; individual fleet results vary by industry, geography, and operating conditions. Pricing and market data reflect publicly available information as of April 2026.
Last updated: April 2026.

Share:
GPS Trackit Alternative for Small Service Fleets: 2026 Comparison
Bouncie vs Spytec GPS (2026): Consumer Tracker or Fleet Platform?